Invited by Journal of hydrology, Dr. Yonggen Zhang from ISESS and Dr. Marcel Schaap from the University of Arizona recently published a review paper entitled “Estimation of saturated hydraulic conductivity with pedotransfer functions: A review".
Saturated hydraulic conductivity (Ks) is a singular parameter in earth system science. Ks not only governs the rate of flow of water under a hydraulic gradient as specified by the Darcy equation for saturated conditions, but also acts as a scaling factor in many unsaturated flow and transport applications that involve pore-size distribution models. Without knowledge of saturated hydraulic conductivity, it would be difficult to accurately describe the transport of water and dissolved or suspended constituents in soils and sediments, or calculate groundwater transport and recharge, and quantify the exchange between soils and the atmosphere. While the determination of Ks is not especially difficult, it is expensive and (in many cases) infeasible to carry out field or lab experiments for large-scale applications. Pedotransfer functions (PTFs) are a class of largely data-driven empirical models that aim to estimate Ks (and often other hydraulic quantities such as water retention characteristics) from easily available data. In this review, we first briefly discuss the history of the development of the concept of saturated hydraulic conductivity and its relation to the Kozeny-Carman (KC) equation. The KC equation serves as a central point in this review because it determines which soil variables affect saturated flow at the pore-scale, a domain which now can also be visited by computational fluid dynamics models. The KC equation also provides us with a structure in which we can classify the large number of PTFs that have been developed for estimating Ks. Datasets and statistical techniques available for PTF development are discussed, and we also describe common metrics used to assess the accuracy and reliability of PTF estimates. The mutual agreement of two main classes (i.e., an effective porosity KC-based and soil texture-based) of PTFs is analyzed using a number of global maps of predicted Ks. Finally, we discuss challenges and perspectives that might lead to PTFs with improved estimates of Ks. In particular, we suggest establishing and utilizing large and completely independent databases to assess the accuracy and reliability of PTFs for global use, while also drawing in information from pedological and remote sensing sources.
The work is supported by National Natural Science Foundation of China (grant 41807181).
Yonggen Zhang*, Marcel G. Schaap*, 2019. Estimation of Saturated Hydraulic Conductivity with Pedotransfer Functions: A Review. Journal of Hydrology. 575, 1011–1030. https://doi.org/10.1016/J.JHYDROL.2019.05.058
For the full access to the paper, please find the link here:
https://www.sciencedirect.com/science/article/pii/S0022169419305049?via%3Dihub
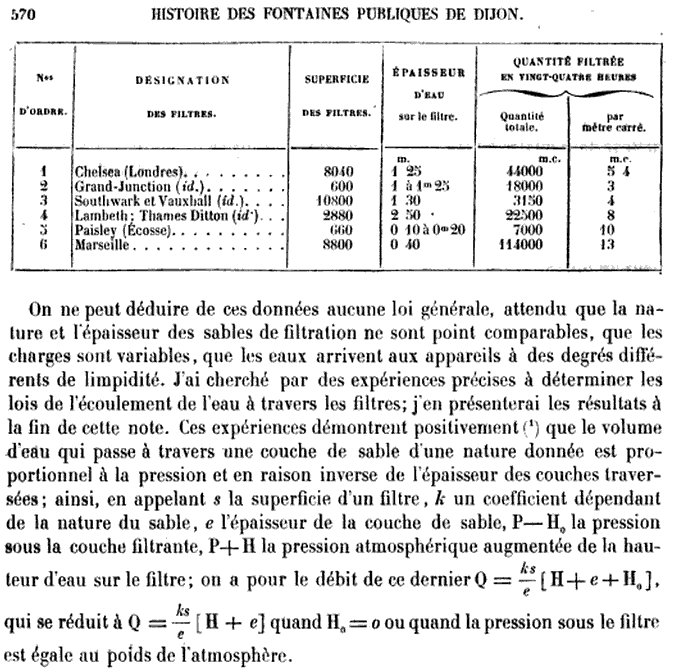
Figure 1. An Excerpt of Darcy’s (1856) appendix D in which he presents his empirical law.
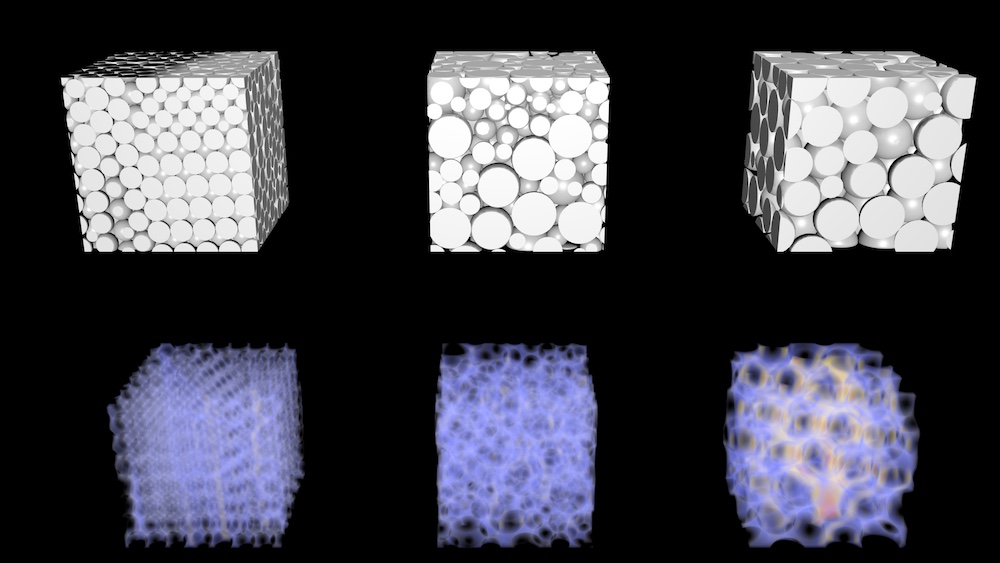
Figure 2. Top left: a volume with 1200 small particles. Middle: 75 large and 600 small particles. Top right: 150 large particles. Bottom row: Lattice Boltzmann simulated flow fields and relative speeds (blue for low speed, yellow and red for mid and high speeds, respectively).
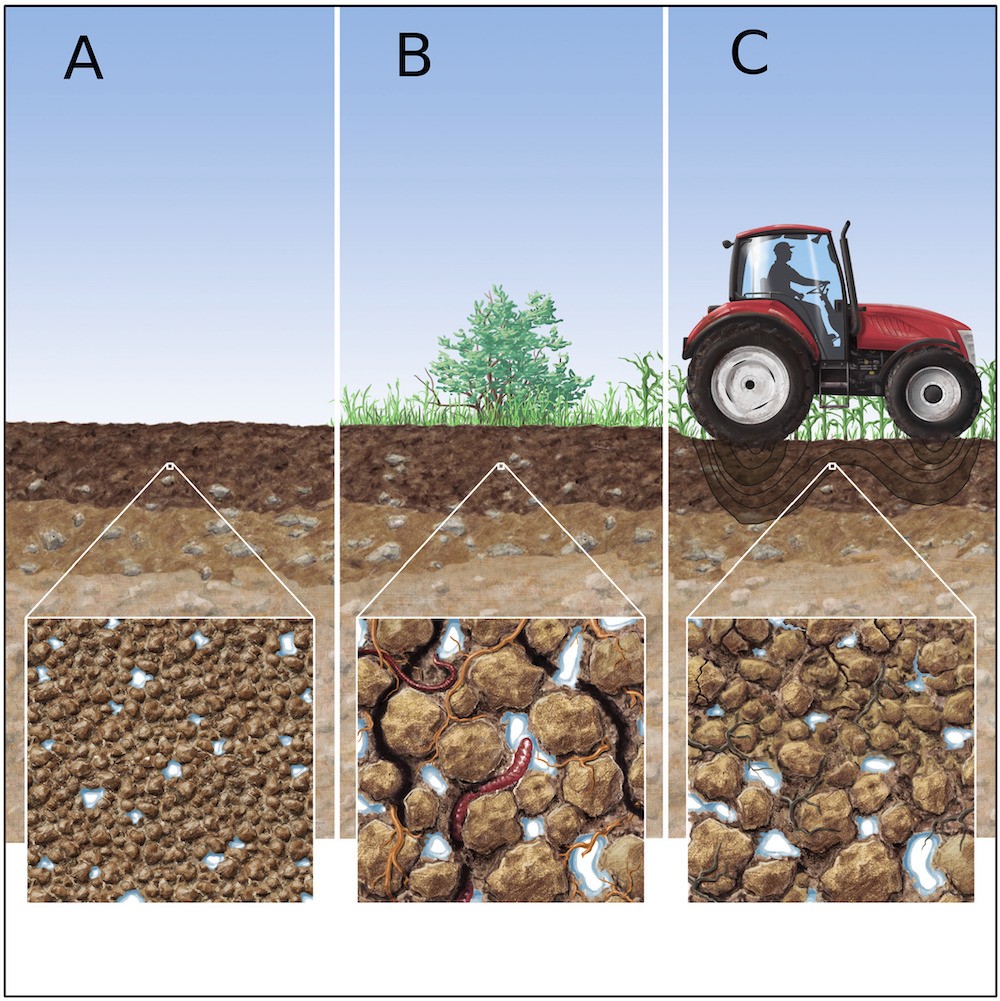
Figure 3. Schematic illustration of soil structure along a transect. Each subgraph indicates a different soil structure: (a) Homogeneous soil. (b) The same soil with secondary structure from biological activity. (c) Soil structure from (b) but damaged by compaction. From Romero‐Ruiz et al. (2018).
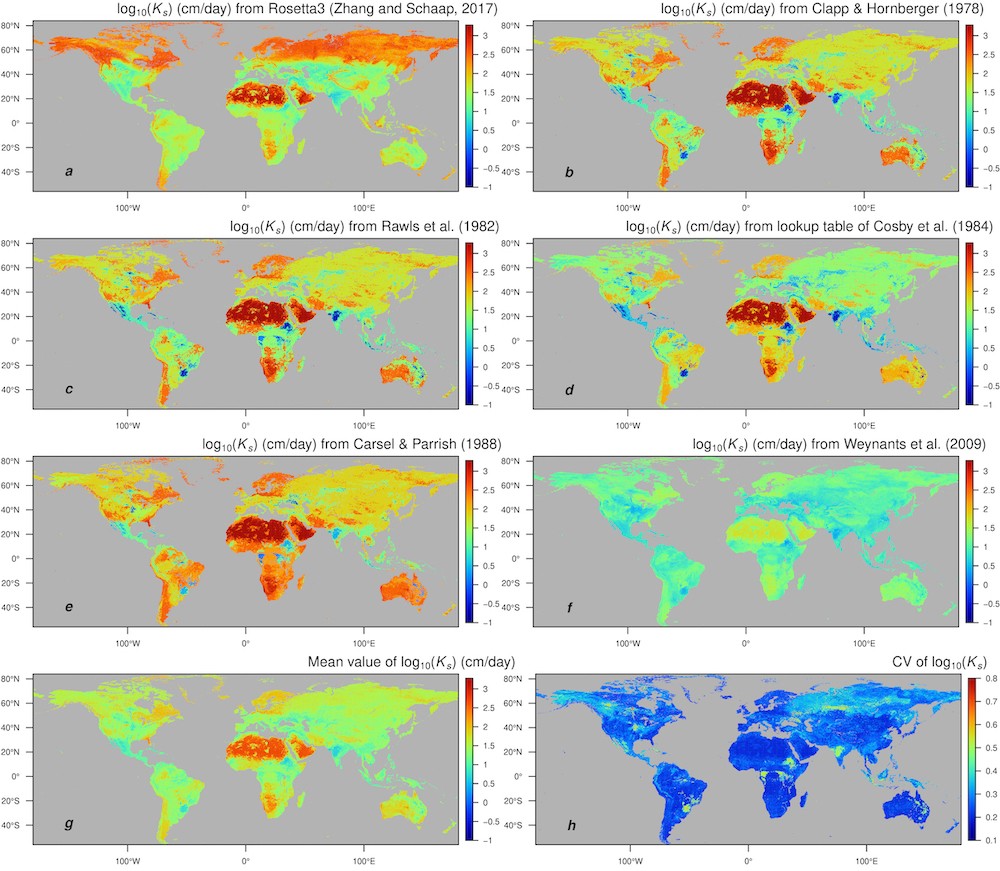
Figure 4. Global maps of (a) mean values and (b) coefficients of variation (CV) of effect porosity (macroporosity) in 10 km resolution from overall 13-PTF ensemble model employed in Zhang et al. (2019). Weights for different PTFs are based on the average values of 100 bootstrap replicas of optimized weights. Calculations are based on the surface soil of SoilGrids 10 km data set (Hengl et al., 2014).
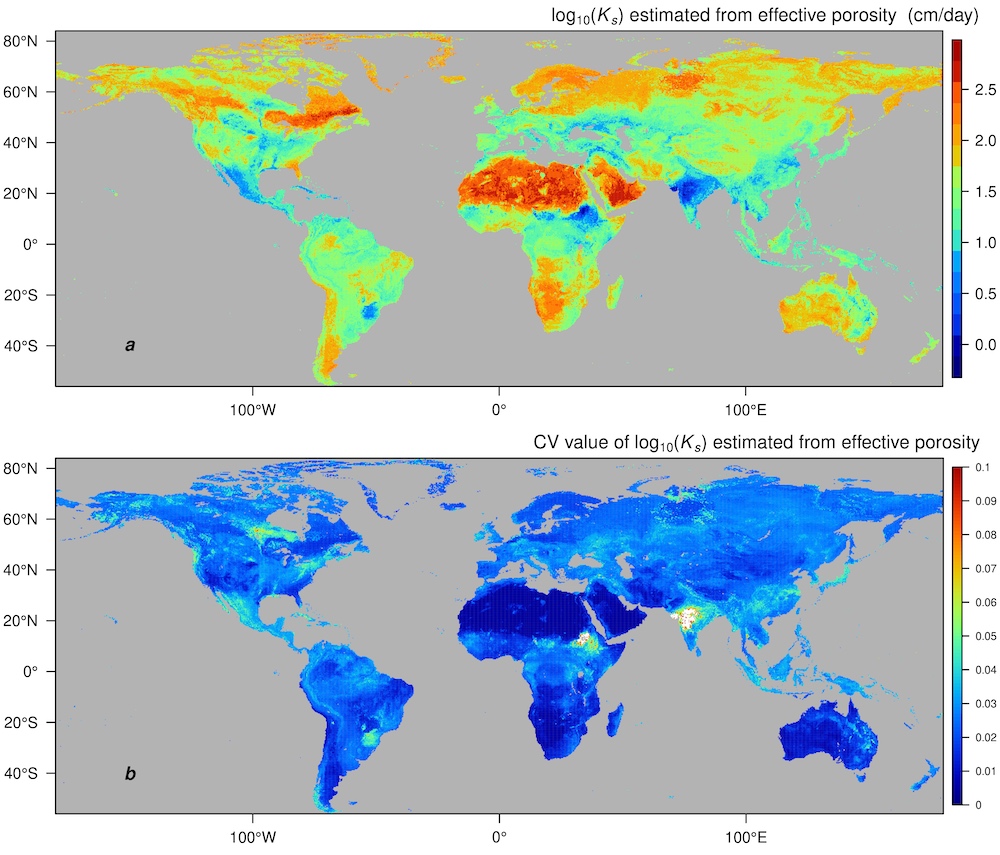
Figure 5. Global map of saturated hydraulic conductivity (log10(Ks)) in 1 km resolution estimated from (a) Rosetta3 H3w model (Zhang and Schaap, 2017) by employing soil textural percentage and bulk density data as input. (b) Clapp & Hornberger (1978). (c) Rawls et al. (1982). (d) Cosby et al. (1984) lookup table. (e) Carsel & Parrish (1988). (f) Weynants et al. (2009) models. (g) Mean values. (h) Coefficient of variation of log10(Ks) are also shown. Calculations are based on the surface soil of SoilGrids 1 km data set (Hengl et al., 2014).